Security Metrics FAQ: Measuring What Actually Matters
Move beyond vanity counts to metrics that reveal true risk exposure and operational efficiency for your organization.

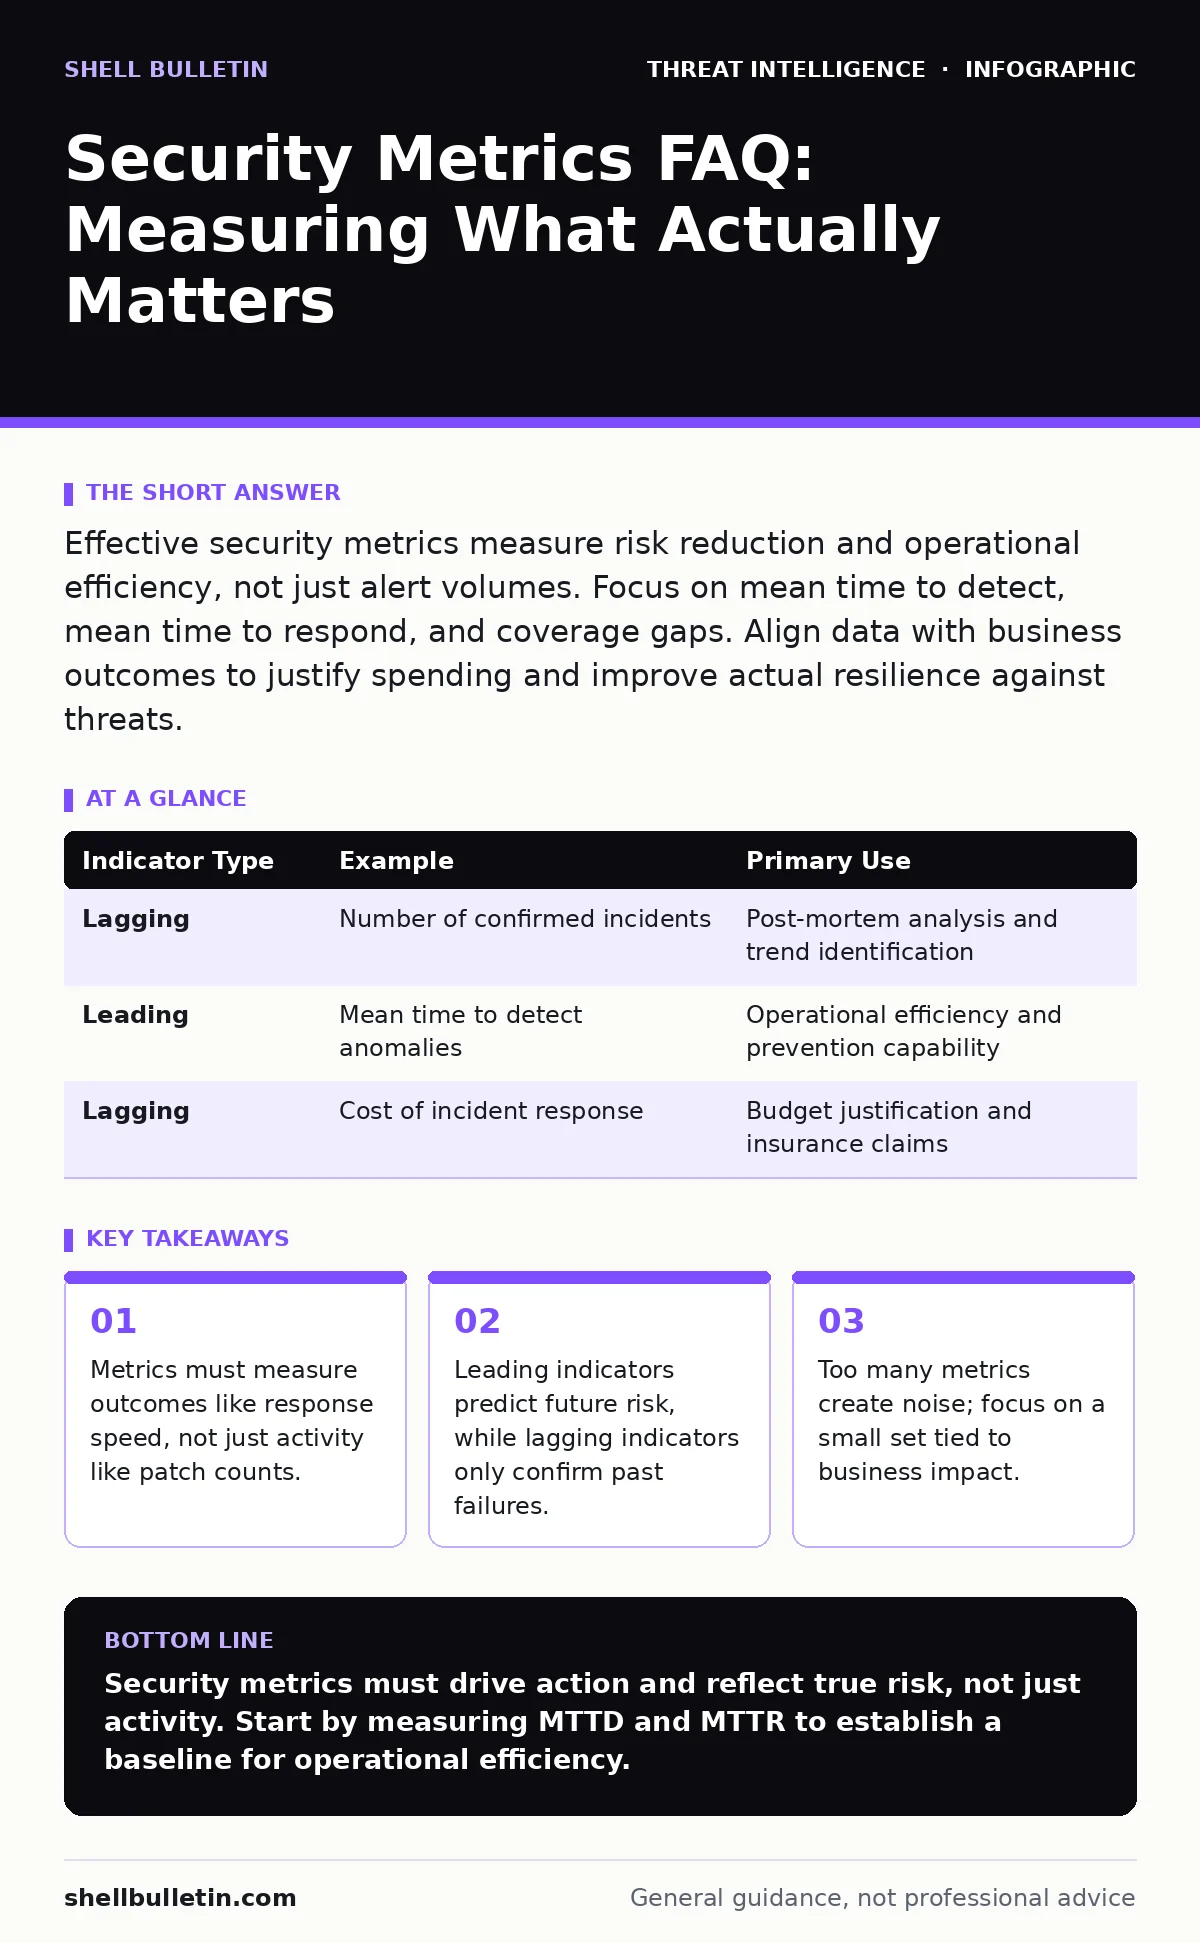
Effective security metrics measure risk reduction and operational efficiency, not just alert volumes. Focus on mean time to detect, mean time to respond, and coverage gaps. Align data with business outcomes to justify spending and improve actual resilience against threats.
What makes a security metric actually useful?
A useful security metric links a technical action to a specific business outcome or risk reduction. It must be actionable, meaning you can change a process based on the result. If a number cannot drive a decision, it is vanity data.
Imagine tracking the total number of firewall rules. This number grows over time but tells you nothing about security posture.
Why do most security metrics fail?
Most metrics fail because they measure activity rather than effectiveness. Counting the number of patches applied shows effort, not security. It ignores whether the patches were applied in time to prevent exploitation.
This creates a false sense of security. Teams celebrate high patch rates while critical vulnerabilities remain unaddressed due to testing delays or compatibility issues. The metric measures compliance, not protection.
What is the difference between leading and lagging indicators?
Lagging indicators measure events after they occur, such as the number of breaches or data lost.
Lagging indicators are easy to measure but useless for prevention. Leading indicators require more effort to collect but allow you to act before an incident happens.
| Indicator Type | Example | Primary Use |
|---|---|---|
| Lagging | Number of confirmed incidents | Post-mortem analysis and trend identification |
| Leading | Mean time to detect anomalies | Operational efficiency and prevention capability |
| Lagging | Cost of incident response | Budget justification and insurance claims |
How do you measure detection capability?
Mean Time to Detect (MTTD) measures the average time between a threat entering your environment and your team identifying it. Lower MTTD reduces the window for attackers to move laterally or exfiltrate data.
You calculate this by timestamping the initial compromise and the first alert or investigation. This metric exposes gaps in your monitoring coverage. If MTTD is high, you likely lack visibility into specific network segments or application logs.
How do you measure response effectiveness?
Mean Time to Respond (MTTR) measures the average time from detection to containment. Containment means stopping the threat from causing further damage, not necessarily full remediation.
MTTR reveals the efficiency of your incident response procedures. A high MTTR often indicates unclear roles, slow approval processes, or automated tools that fail to isolate systems. Focus on reducing the steps between alert and isolation.
See also: Fix CIA Triad Misconceptions to Strengthen Your Security Posture · Threat Intelligence Platforms: Real Value vs Operational Noise
What is the hidden cost of alert volume?
High alert volume often indicates poor tuning, not high threat activity. Security teams suffering from alert fatigue miss critical signals because they ignore repetitive noise.
The hidden cost is delayed detection. When analysts dismiss alerts as false positives, they may overlook a sophisticated attack hiding in plain sight. Metric-wise, track the ratio of false positives to true positives. If this ratio is high, your detection logic needs refinement, not more tools.
How do you measure patch management efficiency?
Vulnerability Exposure Window measures the average time a known vulnerability remains unpatched on your systems. This is more accurate than counting patched servers.
It accounts for the delay between vendor release and your deployment. A long exposure window increases the risk of exploitation, especially for vulnerabilities with public exploits. Track this by vulnerability severity to prioritize critical fixes.
Why is coverage more important than tool count?
Tool count measures how many security products you buy, not how much of your environment they protect.
Gaps in coverage create blind spots. Attackers target these unmonitored areas because they know alerts will not trigger.
How do you align metrics with business risk?
Map each technical metric to a business impact, such as revenue loss, regulatory fines, or brand damage. This translation helps non-technical stakeholders understand security value.
It justifies security spending by showing direct risk reduction.
Key takeaways
- Metrics must measure outcomes like response speed, not just activity like patch counts.
- Leading indicators predict future risk, while lagging indicators only confirm past failures.
- Too many metrics create noise; focus on a small set tied to business impact.
Security metrics must drive action and reflect true risk, not just activity. Start by measuring MTTD and MTTR to establish a baseline for operational efficiency.
Frequently asked questions
How many security metrics should I track?
Track five to seven core metrics that align with your biggest risks. Too many metrics dilute focus and create analysis paralysis.
Should I automate metric collection?
Yes, automate data collection to reduce manual error. However, review the logic regularly to ensure it still reflects your environment.
How often should I review metrics?
Review operational metrics like MTTD weekly. Review strategic metrics like coverage quarterly to adjust long-term plans.
Can metrics prove security ROI?
Metrics can show risk reduction, which is a form of ROI. Avoid trying to assign dollar values to prevented incidents, as this is often speculative.
How this guide was produced: written by the Shell Bulletin editorial team with AI assistance, checked against the public references listed below, and reviewed when the facts change. See our editorial policy or report an error.